Showing posts with label social studies. Show all posts

Thursday, 23 February 2017

children, children, what do you see?


Sometimes a photograph is a provocation.

It can be an image that elicits a conversation. That tells a story, yes. But also, one that asks a question. That asks the viewer to respond, to bring to it what he or she knows. To synthesize existing information with new.

Showing a class a photo of something in their local environment, allows the students to show and tell you what they know. To share it with the other kids. To be the experts. To be the teachers and the storytellers.


_______________________________________________

Years ago, I realized that I couldn’t teach very much of the Grade One Social Studies curriculum through text books or other ready-made media, because so many of the objectives are specific to the community my students live in. And there’s no text book for that. I would have to create my own resources; letting the lived experience of being in Peace River, Alberta, Canada — a very specific place, at a very specific time — be my source material. The natural and constructed environments would be the “third teacher” in my students’ lives. (After their parents and myself.) (That’s a tenet of the Reggio Emilia approach to primary education.)

So I started taking photos that could provoke conversations around the curriculum objectives.

________________________________________________


1. Local Landmarks

One fall, I went out and took pictures of local landmarks in my small town of Peace River, Alberta. Places the kids would know, like the school, the swimming pool, the gymnastics gym and the hockey arena. Places like the movie theatre, the fast food restaurants, and stores. Places they should know, like the library and the museum and the town hall. I compiled these into a slide show, and we spent about a week discussing all of the landmarks; one or two slides at a time.


A river runs through it. These photos opened up discussions about rivers, islands, hills, valleys,
 and bridges. The top photo was taken by my husband, Tom Tarpey. The other two are mine.


The kids had lots to say. I added bits of information to fill in the gaps. I added context for some of the landmarks using Google Maps, to show where they were. We used the satellite view to look at our local landscape; the map view to identify streets and bridges, and the street view to “walk” down the main street of town. I asked the kids to give me directions (verbally) from one place to another. “If I am looking at the Town Hall, which way do I have to turn to go to A&W?” “If I walked across this bridge, where would I end up?” And so on.


The old train station.


Wooden sculpture of "Twelve Foot Davis" -- a gold miner,
and the stuff of local legends.


The Peace River town hall. Note the Town of Peace River logo on the
near end.


I printed some of the landmark photos we had looked at on card stock, and cut them into the shapes of postcards. The kids dictated a sentence or two about the landmark on their postcard to myself or a teacher aide, and we wrote them on the reverse sides of the cards as letters to their moms and dads. Then we addressed them and mailed them. Along the way the kids practiced reciting their addresses. (Not because this is curriculum, but just because it's important for them to know.)


Top: The MacKenzie Museum and Archives.
Middle: An artifact that lives outside the museum. It's the axle from the old paddle-wheeled
boat that used to be the main way in or out of Peace River.
Bottom: local mural of the paddle wheeler.

To extend the concept of local landmarks (because the landscape is a landmark), I taped a map of our town to a tray, and put out blue and green plasticine. I asked the kids to cover the water with blue, and the land with green. If we hadn’t run out of time, I would have added Lego blocks and centimetre cubes for the kids to make houses and restaurants and bridges, etc.


And finally — on a slight tangent — we looked at the logo of the Town of Peace River. It is a symbol the kids come across in their movements about town, and knowing about it contributes to their visual literacy and sense of place. Signs and symbols are also a part of the Social Studies curriculum. Our logo, happily, is a simplified image of the river that runs through our town and the hills on either side of it, which form our beautiful valley. So the logo is closely connected to the landmarks in our region.


Miriam Gair. Peace River Valley. Watercolour. 2004


We took some time to look at a watercolour painting by once-local artist, Miriam Gair,  which depicts the same landscape as the town logo — layered hills, receding waters, the sun as the focal point — talking about what is the same between the two images, and what is different.

Then we recreated the town logo on paper plates, using plasticine. I cut out “stencils” from sturdy dessert-sized paper plates, and placed each one on top of a whole plate. We squished plasticine into the holes of the stencils, using blue and yellow mashed together to make green (which tied in with our Science work on mixing colours). Then we lifted the “stencil” plates off, and — voilĂ  — we had created images of the town logo, and by extension the local landscape.


Town of Peace River logo project: plasticine landscapes on paper plates.
Finished piece above and lower left. Stencil, lower right.


____________________________________________


2. Long Ago

The history of Peace River — at least in terms of European settlement* — is a short story. Our landscapes are still dotted with the remains of the homesteaders’ cabins who first cleared and farmed the land in this area. We drive by them every time we leave town. So this seemed like a good place to start the discussion about the “long ago” past of this area.

I took a photo of a fallen-down homestead. (I have since taken more.) We looked at it and talked about its size and configuration (one room), what it was made out of (wood), and where the people would have gotten their materials. Who lived in the house? How many people? How did they keep warm? What did they eat? Where would they have gotten their food? Their clothing?


We talked about gardens and barns and outhouses. (Oh, my!) We talked about roads and churches and schools and, eventually, stores; all of this “development” organized around the central concepts of basic human needs. (A topic which is relevant to the Social Studies, Science and the Health curricula.)

The kids drew pictures of what it might have looked like here “100 years ago.”


All of this became the jumping-off point for other activities about our first farmers.

__________________________________________________


* We had been discussing the Aboriginal peoples in our region (long, LONG ago and now) since much earlier in the year. 

Saturday, 18 February 2017

what makes a city....


I teach Grade One in a town of 6000-and-some people. The nearest city of any size is 500 km away. Most of my kids have been to the city at least once, but most likely just to the (West Edmonton) Mall. Or maybe to see family.

Our Social Studies curriculum calls for an understanding of rural and urban communities. We spent quite a bit of time looking at pictures of cities and talking about what it means that a city is "bigger" than a town, working on the general concept of more. More people, which means more houses and apartment buildings for them to live in, which means more roads for the houses to be on, which means more cars, buses and trains. And so on. More stores. More gas stations. More signs. More traffic lights. More parking lots. You  name it.

For our "Building Things" unit in Science, we learned to make pop-ups. So we used our pop-up-making skills, markers, scrap paper, and small yellow stickers (for windows) to make little three-dimensional urban landscapes.


Then we did some writing. The kids drew cityscapes, then finished the sentence: "A city has lots of ________." (Or wrote a sentence of their own.) It seems that lots of cities have super heroes, by the way. And other people standing on the tops of high buildings. With parachutes.

(Not sure if that is in the Social Studies curriculum, strictly speaking.)


"I saw one of my cousins at the hospital."


Saturday, 25 June 2016

self-portrait as a dot....


Every year on or around September 15th, teachers and students around the world celebrate International Dot Day. Based on Peter H. Reynolds' book The Dot, kids are encouraged to explore their creativity, starting from something as unpromising as a dot.


This usually coincides with my colour mixing unit in Grade One science. So one year I had my students paint themselves as dots.

First, I handed out paper dessert plates (sturdy ones). The kids painted them with one of the primary colours (red, blue or yellow) in a watercolour wash. Then they got to choose a second primary colour to mix with the first one by dropping it into the wet paint that was already on the plate.

The next day, I handed out pieces of acetate that had been cut to the right size for the plate. I gave the kids permanent black markers, and asked them to draw their own faces. Then I tacked the plates up  with the portraits in front of the wash they had made.


Lastly, I "connected the dots" with string when I put all the portraits up on a bulletin board. This became a provocation in exploring the meaning of "community," and specifically of our class as a community.


I think if I were to do this again, I would let the kids draw the lines between the dots with white chalk, to show and talk about how they are connected to each other. To map our classroom community. Maybe arrange the dots in a circle, to simplify it.


SaveSave
SaveSave
SaveSave
SaveSave
SaveSave

Sunday, 26 April 2015

dyeing to know....


I’m in love with teachings that cross over curriculum boundaries. This one hits objectives in Science, Social Studies, Language Arts and Art.

So.

I wanted to dye Easter eggs using natural dyes with my kids this year, but I ran out of time before Easter. I knew I needed to experiment a bit to see what works (as far as both products and processes).

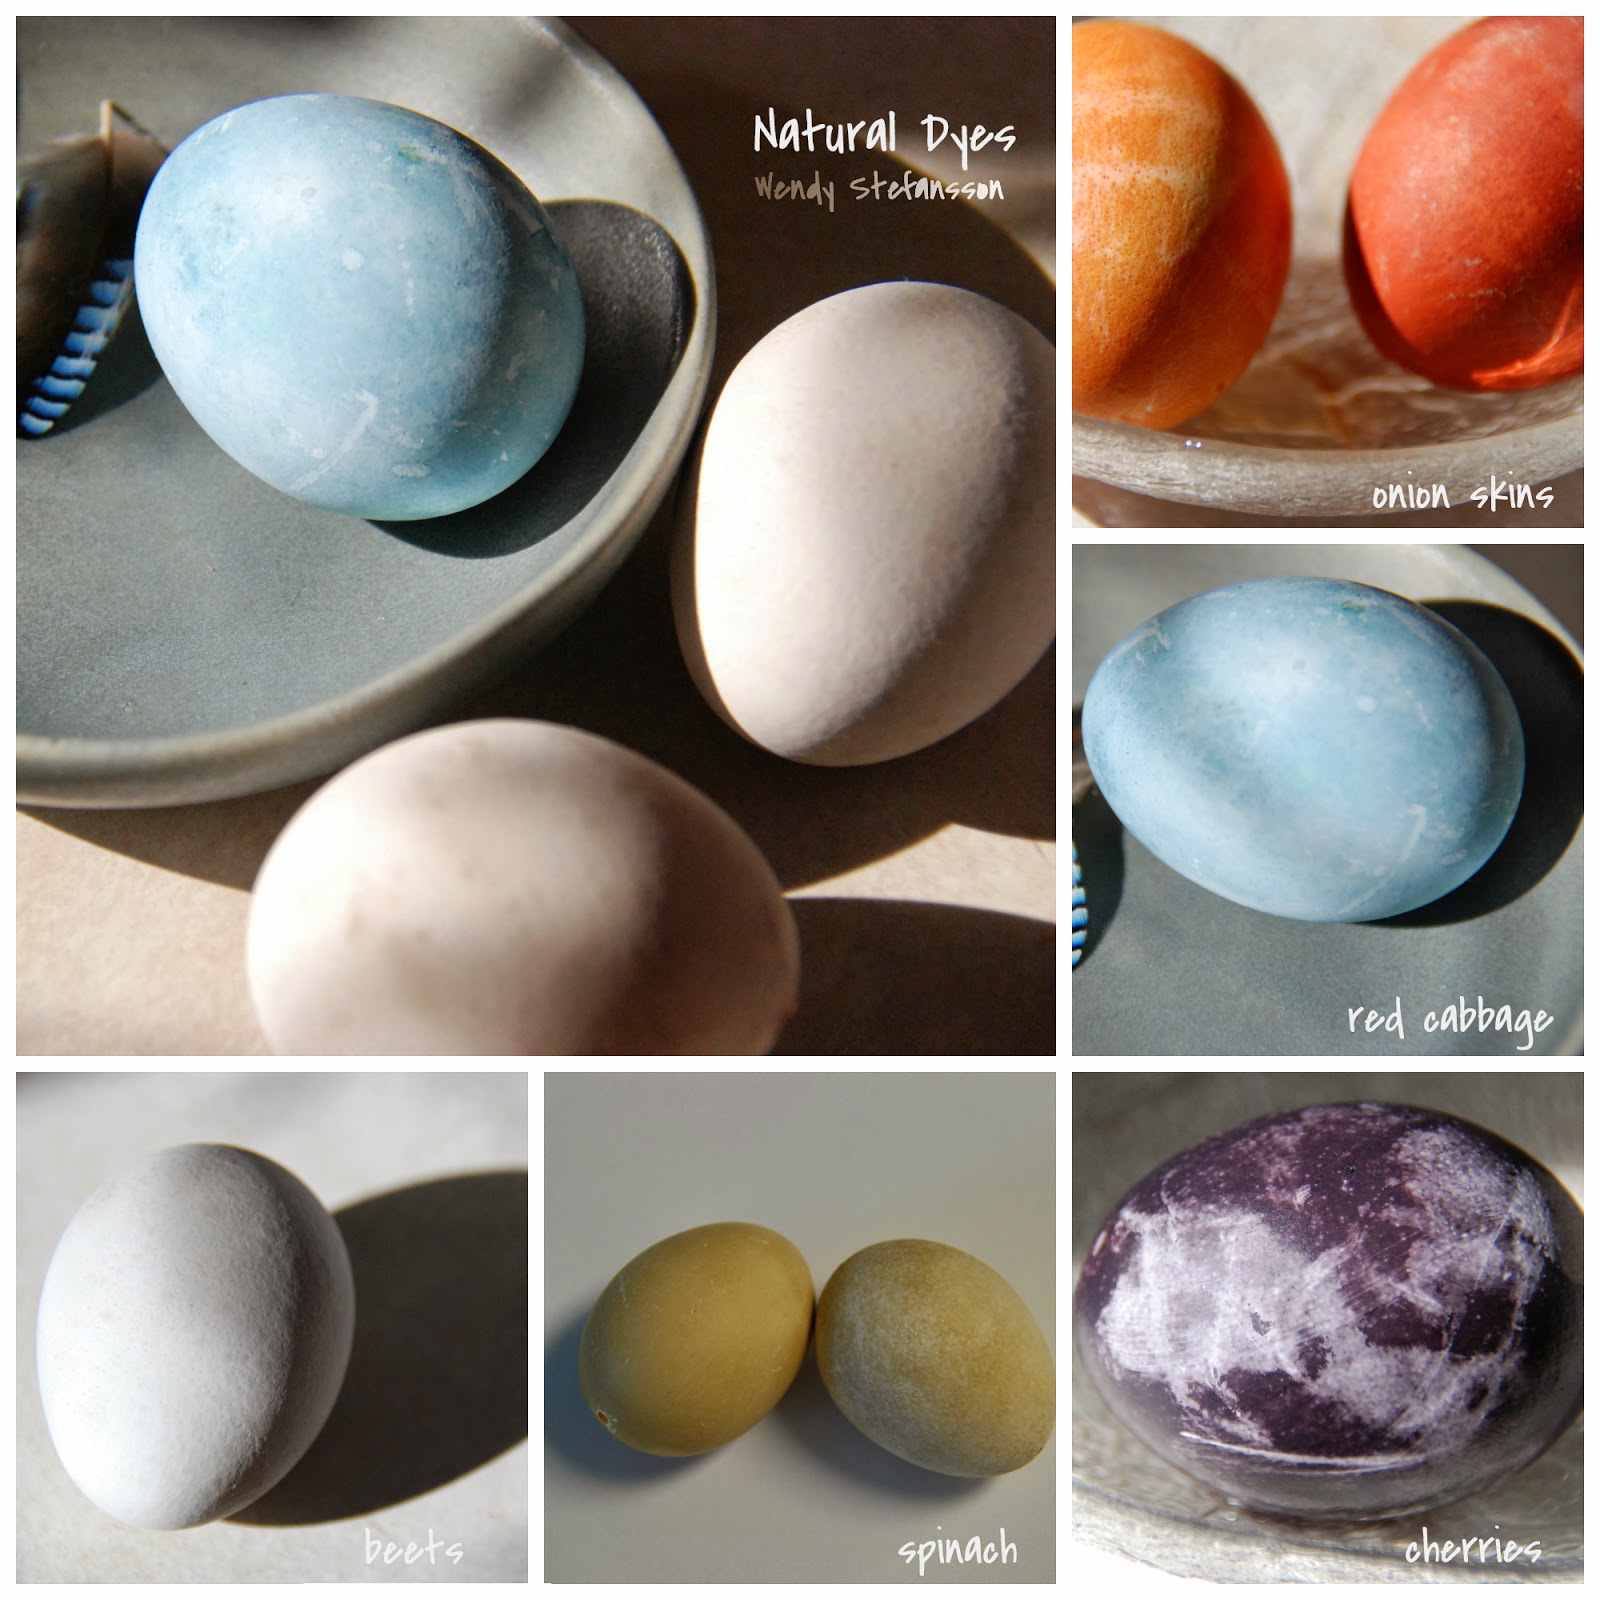
So over the school break I played around in my kitchen at home, making dyes from the following substances: onion skins, red cabbage, beets, spinach, and cherry juice. I won’t go into the how-to’s because they’re on dozens of blogs you can find through Pinterest. But I will say, it takes a surprisingly long time to get colour from natural materials. Most of my eggs were in their dyes for at least 12 hours, and some 18. The onion skins were the fastest; but I never did get colour out of my beets.


When school resumed, I took in the results of my egg-dyeing experiments, along with some raw wool I got from my local museum. I took in a hand-knitted sock (also from the museum, and also made from unprocessed wool). And I set them all up as a provocation with a few questions:

Which dye do you think made which colour? (The big surprise being that “red” cabbage, which is actually purple, dyed the eggs blue.)
What is the material in the bowl? (the raw wool)

The provocation.


Over the course of the week, I revealed the answers to these questions, but many more were asked. We read Weaving the Rainbow by George Ella Lyon, and Charlie Needs a Cloak by Tomie de Paola. We watched videos on youtube that showed spinning and knitting. I showed them slides of my trip to Peru, during which my family visited a small llama/alpaca farm and saw traditional dyeing and weaving being done. We talked about resourcefulness, and how people (“long ago”) would have had to make their own dyes, their own wool or other fibres, and their own clothing out of what they could find or grow locally. 


Then we tried to dye our wool in our natural dyes. The onion skin dye was effective, but nothing else was; even ones that had worked on the egg shells. But that was a good learning moment too. Not everything works the first time you try it. And there once was a world in which everything didn’t come with instructions on the package and money-back guarantees.

We wrote hypothetical letters to our great-grandparents, listing all of the steps they would need to complete if they wanted some new socks for the winter; starting with shearing a sheep and ending with knitting. We talked about how much time and effort that would take, and how precious those socks would be to you; how you would have fewer pairs of socks and how you would darn them if they got a hole in them. And we compared that whole process to our contemporary one: driving to Walmart to buy a pair of socks for a few dollars. Throwing them out when they got holes in them.

We talked about the awesome skills people would have had a few generations back; and about how their lives were harder than ours. How life has changed. We expanded our concepts of “traditional” and “modern,” as well as “natural” and “synthetic,” “transparent” and “opaque,” "paint" and "dye." We compared the vibrant colours of our times with the comparatively muted, watercolour tones of “long, long ago;” as well as the smelliness of things like natural wool and cabbage dye, compared to our scent-censored lives today. We talked about how much itchier and scratchier clothes must have been for our great-grandparents.

Next, we tried our hands at a simple weaving project.

Wednesday, 25 February 2015

measuring up....


I love it when a project crosses curriculum boundaries, and connects the dots among different areas of study -- say, Social Studies and Math. I am also looking for ways to go deeper into concepts that sometimes seem self-evident: concepts like “rural” and “urban.”

I live and teach in a town of 6,000 people, and it’s the biggest town for thousands of square kilometres in this part of the world. The nearest city is 200 km away, and it’s not that big (approximately 55,000 people). The nearest city of any size is 500 km away. Most of my kiddos have been there, but their experience of big cities is still fairly sketchy. To say that cities are “big” and towns like ours are “small” may not be enough. What means “big”? And what means “small”?

So I set up a provocation. I drew a simplistic city skyline on paper on one table, and a “small town” on another table of similar size. I set out Numicon shapes and pencils and pencil crayons.

(Numicon is a set of manipulatives that teach early numeracy concepts in a multi-sensory way. Sturdy plastic shapes with holes in them represent each of the numbers to 10. They are sized and weighted so that kids can discover equivalencies in a number of ways. And best of all, they can pick them up, turn them around, put their fingers or pegs in the holes, immerse them in sand, press them into play dough, and so much more.)

I challenged the kids to find out how many people could live in the buildings I had drawn. I showed them how to trace the Numicon shapes to fill in the building shapes. Every hole would be like a window one person could look out of. So essentially, we would measure the area/capacity of the buildings using Numicon shapes/numbers.


Over the course of a few weeks, they worked at it and coloured the two skylines mostly in. Was it flawless? No. Was it enough to create an understanding of what “bigger” means when you are talking about cities? Yes, I think so.

So then came the tricky part: how to count up the numbers, clearly much bigger than what my Grade Ones could be expected to know? Fortunately, they had had some experience with constructing “100” in recent weeks.

Can 100 people fit in our "small town"?


The bucket on the left has 100 in it. The bucket on the right will hold the shapes
that fill the buildings in the "small town" in the background.


We started with the “small town.” I asked the kids to predict whether we could fit 100 people in our town; a rudimentary way of estimating. We put 10 "tens" in one bucket of a balance scale. We matched Numicon shapes to the ones that had been drawn and coloured on the buildings; then moved them all into the other bucket of the balance scale. We found out that there were fewer than 100 people living in our "small town." Next, we removed tens from the first basket until it was lighter than the shapes from the town. We added "ones" to that bucket until the two buckets were balanced — and therefore equal. Using tens and ones made them easy to count; and also served as an illustration of how place value works. In this way, we were able to determine that our “small town” would accommodate 72 residents.


Estimating the population of our "big city".


With that information and experience, I asked the kids if they thought our “city” could accommodate 100 people. Everybody thought so; so I asked them to estimate how many hundreds they thought could fit in it. I recorded their estimates, and we began to count.


Adding shapes to the balance scale that match the ones on the drawing.


It's a long process....


For the big city, we decided to count 100 at a time. We put 10 “tens” in one bucket of the balance scale. Then we looked at the shapes that we had coloured inside the skyline buildings one at a time. For each drawn shape, we put the matching plastic shape in the second bucket of the balance. As we did so, I tagged the shapes we had counted with sticky notes so we wouldn’t count them twice or miss any of them. As our two buckets achieved equilibrium we counted it as 100, and put a sticky note on the side of the paper noting 100 more each time.


We use sticky notes to cover the shapes we had already counted.


Periodically, we reviewed our estimates. After counting three hundreds, for example, I asked them if they thought there would be one hundred more. Two hundreds? Three?


Here, the "living space" for 300 people is covered up. Time to revise
some of our initial estimates.


It was a long process, but in the end we determined that the “city” could accommodate 743 people. And interestingly, the very first estimate of “700” was the closest to the final answer.

What we learned is that a city is not only bigger in the sense of the buildings being taller and wider. It also accommodates more people —  a LOT more people — in the same amount of space. In addition, the spaces between the buildings are fewer and smaller; adding to density of the population (not that I used that terminology with the kids).

And that’s a more sophisticated and complex understanding of what “bigger” means.